24 Importing spatial data: elevation and site data
24.1 The gisextension
The NetLogo default installation includes an extension to support GIS that can be used by adding the following to the first section of your script:
extensions [ gis ]This extension allows you to perform a variety of GIS operations and to connect patch and turtle behaviour to data expressed in GIS files, supporting both vector and raster. The description of its contents can be found here: https://ccl.northwestern.edu/netlogo/docs/gis.html
We will only reference a few aspects of GIS in NetLogo. You will find useful examples in NetLogo’s Models Library (e.g., Sample Models > Code Examples > Extensions Examples > gis > GIS General Examples).
24.2 Datasets
The files in “data/Cretedata/” were distributed during our in-person session, courtesy of Prof. Eleftheria Paliou (University of Cologne). Site coordinates were randomly shifted in QGIS to be published online after the session.
We are using:
- Two shape files containing point coordinates of various archaeological sites in the region, corresponding to two aggregated periods (see Minoan Chronology):
EMIII_MMIAsites.shp: Prepalatial sites (Early Minoan III to Middle Minoan IA)MMIBsites.shp: Middle Minoan IB sites
dem15.asc: Elevation data (Digital Elevation Model) at 15m resolutionrivers.shp: Major rivers and streams in Messara Valley
24.3 Loading GIS data
We start by loading all GIS data into separate NetLogo variables. To know about the formats this extension accepts, see here: https://ccl.northwestern.edu/netlogo/docs/gis.html#gis:load-dataset.
globals
[
  ;;; GIS data holders
  sitesData_EMIII-MMIA
  sitesData_MMIB
  elevationData
  riversData
]

...

to load-gis

  ; Load all of our datasets
  set sitesData_EMIII-MMIA gis:load-dataset "data/Cretedata/EMIII_MMIAsites.shp"
  set sitesData_MMIB gis:load-dataset "data/Cretedata/MMIBsites.shp"

  set elevationData gis:load-dataset "data/Cretedata/dem15.asc"
  set riversData gis:load-dataset "data/Cretedata/rivers.shp"

  ; Set the world envelope to the union of all of our dataset's envelopes
  gis:set-world-envelope (gis:envelope-of elevationData)

end
24.4 Readjusting world settings
The second step is ensuring that our world and world view in NetLogo fits the data we want to feed into them. In this case, we need to reduce the DEM resolution to handle all patch processes in a reasonable computation time.
globals
[
  width
  height

  ;;; GIS data holders
  sitesData_EMIII-MMIA
  sitesData_MMIB
  elevationData
  riversData
]

to set-world-dimensions

  ;;; for better performance, we take a multiple fraction of the dimensions of elevationData,
  ;;; so that patches will get average values or more regular sets of pixels

  let patchXpixelScale 0.1 ;;; keep it less than 0.25
  let pixelExtentMargin 50

  set width ceiling ((pixelExtentMargin + gis:width-of elevationData) * patchXpixelScale)
  set height ceiling ((pixelExtentMargin + gis:height-of elevationData) * patchXpixelScale)

  resize-world 0 width 0 height

  set-patch-size 3

end
24.5 Calculating patch dimensions based on GIS data
Before applying the GIS data to NetLogo’s entities, we should try to already calculate and keep an important information about the real-world scale of our model: the dimensions of a patch according to the GIS projections.
We can extend the code above:
globals
[
  width
  height

  areaPerPatch
  patchWidth

  ;;; GIS data holders
  sitesData_EMIII-MMIA
  sitesData_MMIB
  elevationData
  riversData
]

to set-world-dimensions

  ;;; for better performance, we take a multiple fraction of the dimensions of elevationData,
  ;;; so that patches will get average values or more regular sets of pixels

  let patchXpixelScale 0.1 ;;; keep it less than 0.25
  let pixelExtentMargin 50

  set width ceiling ((pixelExtentMargin + gis:width-of elevationData) * patchXpixelScale)
  set height ceiling ((pixelExtentMargin + gis:height-of elevationData) * patchXpixelScale)

  resize-world 0 width 0 height

  set-patch-size 3

  ; Match NetLogo world to the dataset envelope
  gis:set-world-envelope gis:envelope-of elevationData

  ; Calculate area equivalent to a patch

  ; if units are in degrees
  ;set areaPerPatch calculate-patch-area-degrees elevationData

  ; if units are in meters
  set areaPerPatch calculate-patch-area-meters elevationData

  set patchWidth sqrt (areaPerPatch * 10000) ;;; m = ha * 10,000

end
Where calculate-patch-area-meters (and calculate-patch-area-degrees) is a procedure enclosing this simple, yet delicate calculation. GIS files might use projections expressed either in metres or degrees, so we keep both alternative solutions, “commenting out” the one not used in this case. Notice that by defining them separately, we facilitate their use in other models. Here is the code for these procedures:
to-report calculate-patch-area-degrees [ rasterData ]

  ; Get the envelope: [min-x min-y max-x max-y] in degrees
  let env gis:envelope-of rasterData
  let min-lon item 0 env
  let min-lat item 2 env
  let max-lon item 1 env
  let max-lat item 3 env

  ; Calculate central latitude (φ₀)
  let lat0 (min-lat + max-lat) / 2

  ; Get raster resolution (number of cells)
  set width gis:width-of rasterData     ; number of columns
  set height gis:height-of rasterData   ; number of rows

  ; Cell size (in degrees)
  let dlon (max-lon - min-lon) / width
  let dlat (max-lat - min-lat) / height

  ; Earth radius (meters)
  let R 6371000

  ; Area per raster cell in square meters (approximate)
  let patchArea (R ^ 2) * abs dlon * abs dlat * cos(lat0 * pi / 180) * (pi / 180) ^ 2

  ; Report the result
;  print (word "Approximate area per patch: " patchArea " m² (" (patchArea / 10000) " ha) at latitude " lat0)

  report patchArea / 10000

end

to-report calculate-patch-area-meters [ gisData ]

  let env gis:envelope-of gisData

  let gis-width item 1 env - item 0 env
  let gis-height item 3 env - item 2 env
;  print (word "width: " gis-width ", height: " gis-height)

  let num-patches-x max-pxcor - min-pxcor + 1
  let num-patches-y max-pycor - min-pycor + 1
  ;set patch-width gis-width / num-patches-x

  let patchArea (gis-width * gis-height) / (num-patches-x * num-patches-y)
;  print (word "area-per-patch=" area-per-patch)
  set patchArea patchArea / 10000 ; square meters to hectares

  report patchArea

end
When in doubt about the projection of your file, the values obtained for areaPerPatch (ha) and patchWidth (m) when running both solutions will give you a quick hint. In our case, the calculation should be done in metres and, with this code, we will have patches of approximately 145 x 145 metres.
24.6 Applying GIS data to patches
Next, we effectively apply the data to patches using the gis extension primitives:
globals
[
  patchesWithElevationData
  noElevationDataTag
  maxElevation

  width
  height

  areaPerPatch
  patchWidth

  ;;; GIS data holders
  sitesData_EMIII-MMIA
  sitesData_MMIB
  elevationData
  riversData
]

breed [ sites site ]

sites-own
[
  name
  siteType
  period
]

patches-own
[
  elevation
  isRiver
]

to setup-patches

  setup-elevation

  setup-rivers

end

to setup-elevation

  gis:apply-raster elevationData elevation

  set patchesWithElevationData patches with [(elevation <= 0) or (elevation >= 0)]

  ;;; replace NaN values added by the gis extension with noElevationDataTag, so it does not generate problems after
  set noElevationDataTag -9999
  ask patches with [not ((elevation <= 0) or (elevation >= 0))] [ set elevation noElevationDataTag ]

  set maxElevation max [elevation] of patchesWithElevationData

end

to setup-rivers

  ask patchesWithElevationData
  [
    set isRiver gis:intersects? riversData self
  ]

end

to setup-sites

  ;;; gis extension will re-use a site, if it was already created in a position,
  ;;; and modify any values we already set.
  ;;; In order to avoid this, we cannot use gis:create-turtles-from-points

  let datasetPeriod "EMIII-MMIA"
  foreach gis:feature-list-of sitesData_EMIII-MMIA
  [
    vectorFeature ->

    create-site-from-feature vectorFeature datasetPeriod
  ]

  set datasetPeriod "MMIB"
  foreach gis:feature-list-of sitesData_MMIB
  [
    vectorFeature ->

    create-site-from-feature vectorFeature datasetPeriod
  ]

end

to create-site-from-feature [ vectorFeature datasetPeriod ]

  let coordTuple gis:location-of (first (first (gis:vertex-lists-of vectorFeature)))
  let featureName gis:property-value vectorFeature "NAME"
  let featureType gis:property-value vectorFeature "TYPE"

  let long item 0 coordTuple
  let lat item 1 coordTuple

  create-sites 1
  [
    setxy long lat
    set name featureName
    set siteType featureType
    set period datasetPeriod

    set shape "dot"
  ]

end
Notice that the gis extension generates NaN values on those patches outside the raster data. NetLogo does not handle NaNs, which can become a problem later. To solve this, we create a patch-set variable to filter patches with elevation data (patchesWithElevationData) and use a constant noElevationDataTag with an impossible elevation value to mark those outside the heightmap. From now on, we need to be careful not to use the patches primitive, which will call both kinds of patches.
24.7 Higher level procedure: create-map
We wrap up everything in a procedure create-map:
to create-map

  load-gis  ;; load in the GIS data

  set-world-dimensions ;; set world dimensions according to GIS data

  setup-patches ;; use GIS data to set patch variables

  setup-sites ;; create site agents with properties from sitesData

end
24.8 Visualisation
Finally, we need to add some extra code in order to display our data:
to update-display

  display-rivers

  display-sites

  paint-elevation

end

to display-sites

  ;;; sites dated to EMIII-MMIA: yellow
  gis:set-drawing-color yellow
  gis:draw sitesData_EMIII-MMIA 2

  ;;; sites dated to MMIB: red
  gis:set-drawing-color red
  gis:draw sitesData_MMIB 2

  ;;; sites dated to both EMIII-MMIA and MMIB: orange

end

to display-rivers

  gis:set-drawing-color blue
  gis:draw riversData 1

end

to paint-elevation

  ;;; paint patches according to elevation
  ;;; NOTE: we must filter out those patches outside the DEM
  ask patchesWithElevationData
  [
    let elevationGradient 100 + (155 * (elevation / maxElevation))
    set pcolor rgb (elevationGradient - 100) elevationGradient 0
  ]

end
Sites from different periods are visualized in different colours. Patches are coloured according to their elevation (from green to brown). Rivers are drawn in blue.
24.9 Set up procedure and testing
We then we place both in a higher-level procedure, using the conventional setup (and adding its button):
to setup

  clear-all

  create-map

  update-display

end
24.10 Checking the milestone File (module 1)
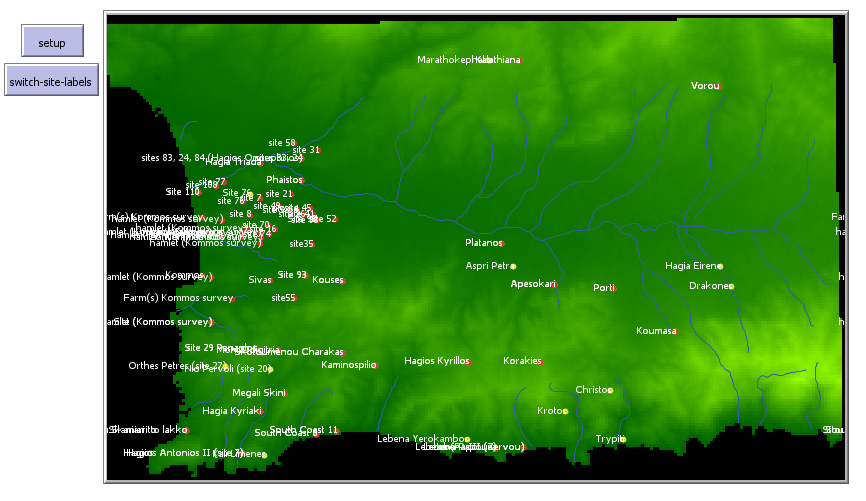
Screenshot of the ‘load-gis-data’ module
See the fully implemented version of this module: BlockC_module1_load-gis-data.nlogo.