21 Implementing output statistics
Apart from minor refactoring, the last implementation steps involve displaying (step 12) and recording (step 13) output statistics. These are essentially aggregate measurements about the state of the simulation at a given time step.
21.1 Displaying outputs in the interface 🤔
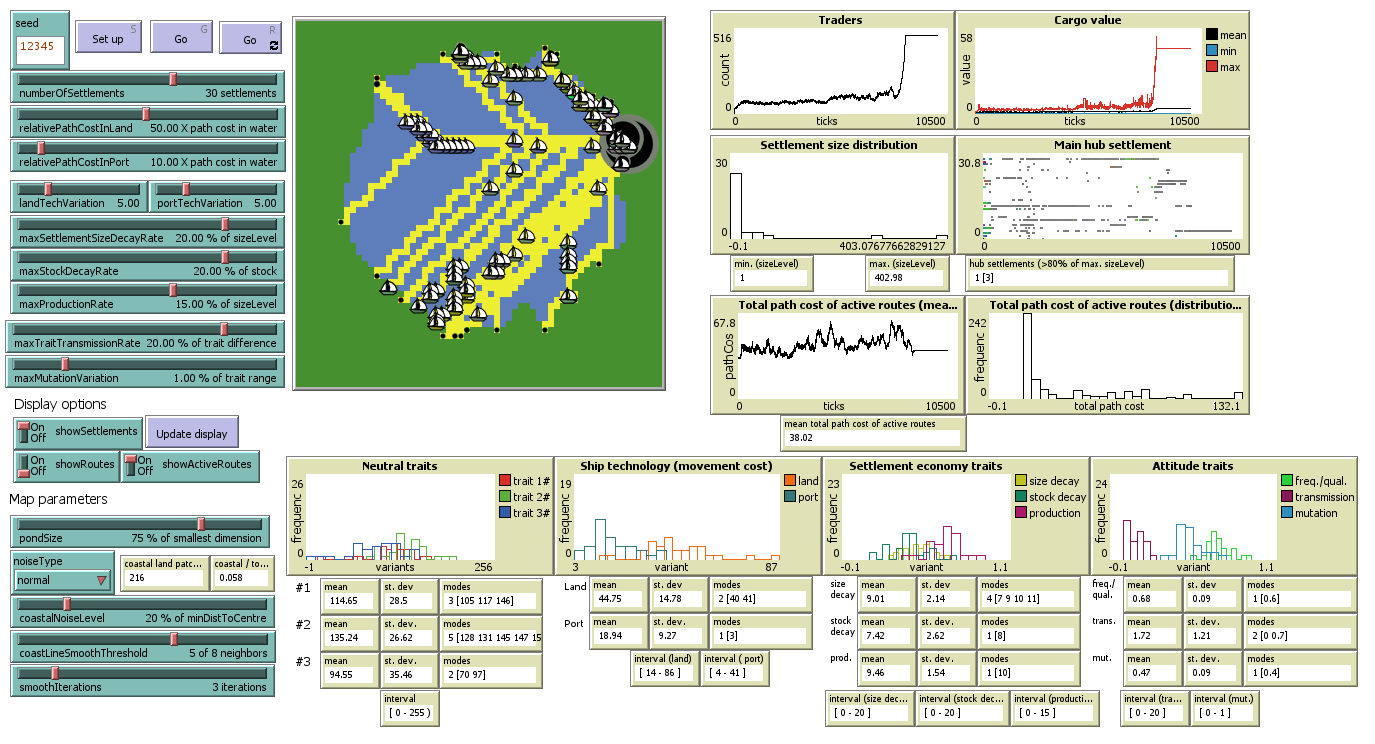
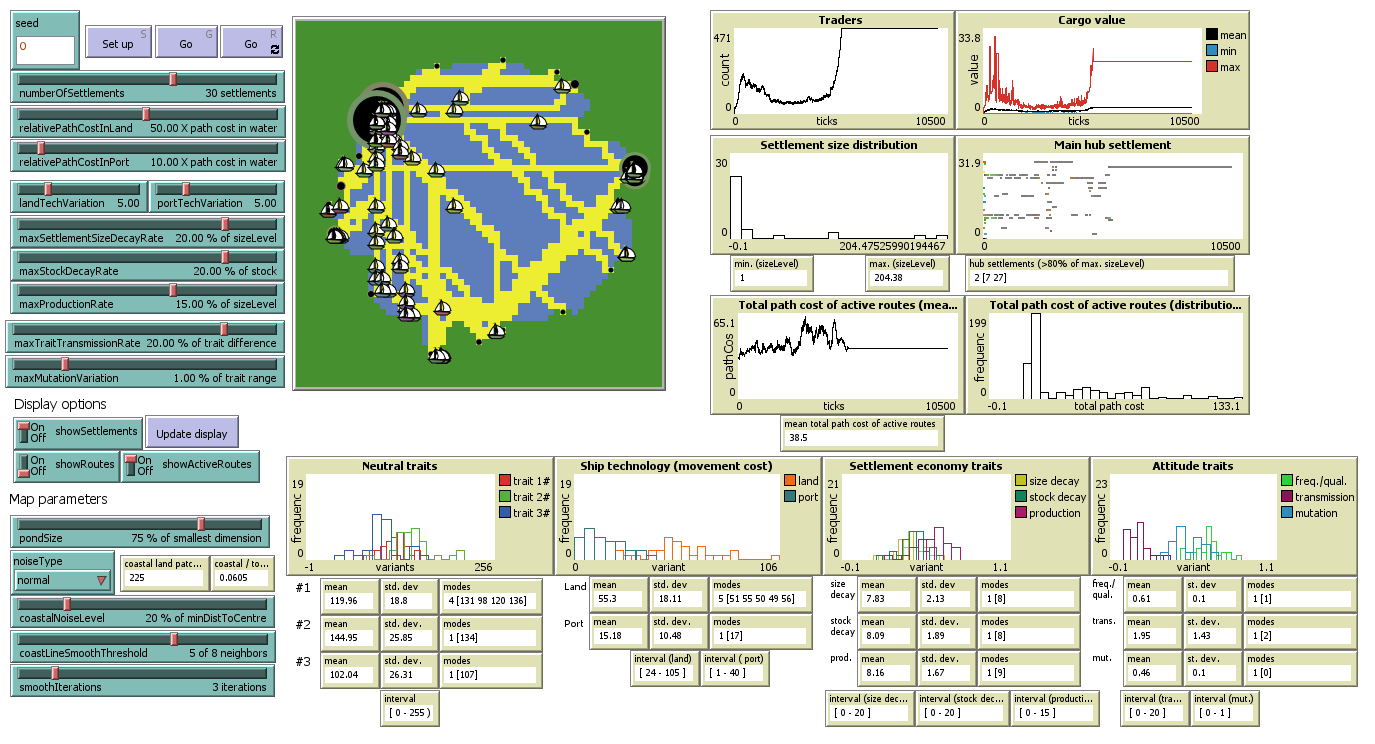
Try out creating a new interface element to display:
- the number of patches and coastal land patches.
- the number of activated traders.
- the mean, min and max cargo value of activated traders.
- the min and max settlement size level, and the main hub settlement.
- the mean, min and max total path cost of active routes.
- the mean, standard deviation and modes of the RGB traits of settlements.
- the mean, standard deviation and modes of the land and port tech traits of settlements.
- the mean, standard deviation and modes of the size decay, stock decay and production traits of settlements.
- the mean, standard deviation and modes of the frequency over quality, transmission and mutation traits of settlements.
21.2 Checking the milestone File (step 12)
Pond Trade step 12
21.3 Recording outputs in variables
The statistics serve as indicators for monitoring complex results while manually running simulations in the interface. Most importantly, they can be used more systematically as data that can be exported for further use in other software, e.g., to perform advanced statistical analyses and more sophisticated graphs.
Here is how step 13 implements those statistics:
globals
[
  routes

  ;;; Output
  patchesCount
  coastalLandPatchesCount

  traderCount

  meanTraderCargoValue
  minTraderCargoValue
  maxTraderCargoValue

  minSettlementSize
  maxSettlementSize
  mainHub

  meanTotalPathCostOfActiveRoutes
  minTotalPathCostOfActiveRoutes
  maxTotalPathCostOfActiveRoutes

  meanRedTrait stdDevRedTrait modesRedTrait
  meanGreenTrait stdDevGreenTrait modesGreenTrait
  meanBlueTrait stdDevBlueTrait modesBlueTrait

  meanLandTechTrait stdDevLandTechTrait modesLandTechTrait
  meanPortTechTrait stdDevPortTechTrait modesPortTechTrait

  meanSizeDecayTrait stdDevSizeDecayTrait modesSizeDecayTrait
  meanStockDecayTrait stdDevStockDecayTrait modesStockDecayTrait
  meanProductionTrait stdDevProductionTrait modesProductionTrait

  meanFreqOverQualTrait stdDevFreqOverQualTrait modesFreqOverQualTrait
  meanTransmissionTrait stdDevTransmissionTrait modesTransmissionTrait
  meanMutationTrait stdDevMutationTrait modesMutationTrait
]

...


;;;;;;;;;;;;;;;;;;;;;;;;;;;;;;;;;;;;;;;;;;;;;;;;;;;;;;;;;;;;;;;;;;;;;;;;;;;;;;;;;;;;;;;;;;;;
;;; OUTPUT ;;;;;;;;;;;;;;;;;;;;;;;;;;;;;;;;;;;;;;;;;;;;;;;;;;;;;;;;;;;;;;;;;;;;;;;;;;;;;;;;;
;;;;;;;;;;;;;;;;;;;;;;;;;;;;;;;;;;;;;;;;;;;;;;;;;;;;;;;;;;;;;;;;;;;;;;;;;;;;;;;;;;;;;;;;;;;;

to update-output

  set coastalLandPatchesCount count patches with [isLand = true and any? neighbors with [isLand = false]]

  let activatedTraders traders with [isActivated]

  set traderCount count activatedTraders

  set meanTraderCargoValue mean [cargoValue] of activatedTraders
  set minTraderCargoValue min [cargoValue] of activatedTraders
  set maxTraderCargoValue max [cargoValue] of activatedTraders

  set minSettlementSize min [sizeLevel] of settlements
  set maxSettlementSize max [sizeLevel] of settlements
  set mainHub max-one-of settlements [sizeLevel]

  set meanTotalPathCostOfActiveRoutes mean [sum (map [ ?1 -> [pathCost] of ?1 ] route)] of activatedTraders
  set minTotalPathCostOfActiveRoutes min [sum (map [ ?1 -> [pathCost] of ?1 ] route)] of activatedTraders
  set maxTotalPathCostOfActiveRoutes max [sum (map [ ?1 -> [pathCost] of ?1 ] route)] of activatedTraders

  set meanRedTrait mean [item 0 culturalVector] of settlements
  set stdDevRedTrait standard-deviation [item 0 culturalVector] of settlements
  set modesRedTrait modes [ round (item 0 culturalVector) ] of settlements
  set meanGreenTrait mean [item 1 culturalVector] of settlements
  set stdDevGreenTrait standard-deviation [item 1 culturalVector] of settlements
  set modesGreenTrait modes [ round (item 1 culturalVector) ] of settlements
  set meanBlueTrait mean [item 2 culturalVector] of settlements
  set stdDevBlueTrait standard-deviation [item 2 culturalVector] of settlements
  set modesBlueTrait modes [ round (item 2 culturalVector) ] of settlements

  set meanLandTechTrait mean [item 3 culturalVector] of settlements
  set stdDevLandTechTrait standard-deviation [item 3 culturalVector] of settlements
  set modesLandTechTrait modes [ round (relativePathCostInLand + item 3 culturalVector) ] of settlements
  set meanPortTechTrait mean [item 4 culturalVector] of settlements
  set stdDevPortTechTrait standard-deviation [item 4 culturalVector] of settlements
  set modesPortTechTrait modes [ round (relativePathCostInPort + item 4 culturalVector) ] of settlements

  set meanSizeDecayTrait mean [item 5 culturalVector] of settlements
  set stdDevSizeDecayTrait standard-deviation [item 5 culturalVector] of settlements
  set modesSizeDecayTrait modes [ round (item 5 culturalVector) ] of settlements
  set meanStockDecayTrait mean [item 6 culturalVector] of settlements
  set stdDevStockDecayTrait standard-deviation [item 6 culturalVector] of settlements
  set modesStockDecayTrait modes [ round (item 6 culturalVector) ] of settlements
  set meanProductionTrait mean [item 7 culturalVector] of settlements
  set stdDevProductionTrait standard-deviation [item 7 culturalVector] of settlements
  set modesProductionTrait modes [ round (item 7 culturalVector) ] of settlements

  set meanFreqOverQualTrait mean [item 8 culturalVector] of settlements
  set stdDevFreqOverQualTrait standard-deviation [item 8 culturalVector] of settlements
  set modesFreqOverQualTrait modes [ round (item 8 culturalVector) ] of settlements
  set meanTransmissionTrait mean [item 9 culturalVector] of settlements
  set stdDevTransmissionTrait standard-deviation [item 9 culturalVector] of settlements
  set modesTransmissionTrait modes [ round (item 9 culturalVector) ] of settlements
  set meanMutationTrait mean [item 10 culturalVector] of settlements
  set stdDevMutationTrait standard-deviation [item 10 culturalVector] of settlements
  set modesMutationTrait modes [ round (item 10 culturalVector) ] of settlements

end
21.4 Checking the milestone File (step 13)
Pond Trade step 13
We could further implement a procedure to export these and more variables at a specific time of simulations. We will see an example of this in Block C. However, in most cases, we want to use NetLogo Behavioral Space. Find it in Tools > Behavior Space. This built-in tool allows you to configure experiments to be run in parallel, within a specific parameter space, and perform a series of commands before, during, or after a simulation run. It includes functionality for exporting simulation data as a CSV file (you will be prompt with a File Explorer window once you press “run” in an experiment).
21.5 Updating the conceptual model
As the final step in developing PondTrade, let us update our second-tier conceptual model, adding a more explicit representation of cultural vectors and their contents.
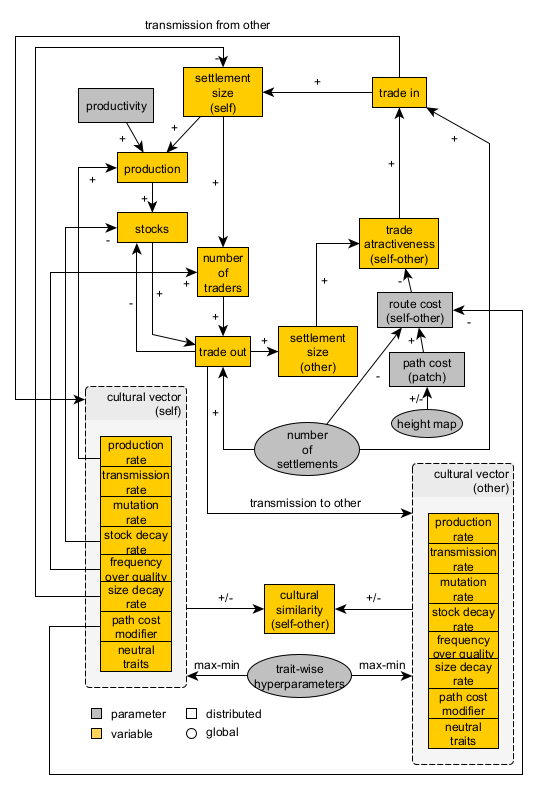
Pond Trade conceptual model at step 13 (second tier)