26 Time series data input: Weather data
26.1 Calculating ARID using weather data
To compromise model complexity and precision, we will regulate land productivity by combining flow accumulation with the Agricultural reference index of drought (ARID). We will calculate a time-series of ARID for each day-of-year and patch using a modified version of the Soil Water (sub)model, again in the Indus Village model (Angourakis 2021). This submodel is a NetLogo implementation of the model defined by Wallach et al. 2019, which is based on Woli et al. 2012.
Wallach, Daniel, David Makowski, James W. Jones, and Francois Brun. 2019. Working with Dynamic Crop Models (Third Edition). Academic Press. https://doi.org/10.1016/C2016-0-01552-8.
Woli, Prem, James W. Jones, Keith T. Ingram, and Clyde W. Fraisse. 2012. ‘Agricultural Reference Index for Drought (ARID)’. Agronomy Journal 104 (2): 287. https://doi.org/10.2134/agronj2011.0286.
We will introduce here a way to import daily weather data (solar radiation, temperature, precipitation) from an external dataset, and use it to calculate ARID, which we will cover in the next chapter.
26.2 The input dataset
To calculate ARID, we will use a point sample of daily weather variables.
The dataset metadata is as follows:
File name: POWER_Point_Daily_19840101_20201231_035d0309N_024d8335E_LST.csv
Source: NASA POWER (https://power.larc.nasa.gov/data-access-viewer/; see their sources and methodology at https://power.larc.nasa.gov/docs/methodology/)
Point location: Petrokefali (LAT: 35.0309; LON: 24.8335)
Time extent: 01/01/1984 - 31/12/2020
Variables: - YEAR, MO, DY: year (number), month (index in year) and day (index in month) of observation/row - PRECTOTCORR: The bias corrected average of total precipitation at the surface of the earth in water mass (includes water content in snow).
- T2M_MIN, T2M_MAX: The maximum/minimum/average hourly air (dry bulb) temperature at 2 meters above the surface of the earth.
- ALLSKY_SFC_SW_DWN: The total solar irradiance incident (direct plus diffuse) on a horizontal plane at the surface of the earth under all sky conditions. An alternative term for the total solar irradiance is the “Global Horizontal Irradiance” or GHI.
26.3 Loading the input dataset
The original implementation in the Indus Village repository includes a procedure only for loading, running, and displaying the dataset as simulation input data.
This module uses the data structure list to hold and process the data. The dataset is loaded from the original CSV file into several global variables (using the CSV NetLogo extension). You may need to look at NetLogo’s Dictionary several times to understand every step in this procedure.
extensions [ csv ]

globals
[
  ;;; weather input data
  weatherInputData_firstYear
  weatherInputData_lastYear
  weatherInputData_YEARS
  weatherInputData_yearLengthInDays
  weatherInputData_DOY
  weatherInputData_YEAR-DOY
  weatherInputData_solarRadiation
  weatherInputData_precipitation
  weatherInputData_temperature
  weatherInputData_maxTemperature
  weatherInputData_minTemperature

  ;;;; Solar radiation (MJ/m2)
  solar_annualMax
  solar_annualMin
  solar_meanDailyFluctuation

  ;;; variables
  ;;;; time tracking
  currentYear
  currentDayOfYear

  ;;;; main (these follow a seasonal pattern and apply for all patches)

  T ; average temperature of current day (ºC)
  T_max ; maximum temperature of current day (ºC)
  T_min ; minimum temperature of current day (ºC)

  solarRadiation ; solar radiation of current day (MJ m-2)

  RAIN ; precipitation of current day (mm)
  precipitation_yearSeries
  precipitation_cumYearSeries
]

...

to load-weather-input-data-table

  ;;; this procedure loads the values of the weather data input table
  ;;; the table contains:
  ;;;   1. 13 lines of metadata, to be ignored
  ;;;   2. one line with the headers of the table
  ;;;   3. remaining rows containing row name and values

  let weatherTable csv:from-file "data/POWER_Point_Daily_19840101_20201231_035d0309N_024d8335E_LST.csv"

  ;;;==================================================================================================================
  ;;; mapping coordinates (row or columns) from headings (line 14 == index 13 -----------------------------------------
  ;;; NOTE: always correct raw mapping coordinates (start at 1) into list indexes (start at 0)
  let variableNames item (14 - 1) weatherTable

  let yearColumn position "YEAR" variableNames

  let solarRadiationColumn position "ALLSKY_SFC_SW_DWN" variableNames

  let precipitationColumn position "PRECTOTCORR" variableNames

  let temperatureColumn position "T2M" variableNames

  let temperatureMaxColumn position "T2M_MAX" variableNames

  let temperatureMinColumn position "T2M_MIN" variableNames

  ;;;==================================================================================================================
  ;;; extract data---------------------------------------------------------------------------------------

  ;;; read variables per year and day (list of lists, matrix: year-day x variables)
  let weatherData sublist weatherTable (15 - 1) (length weatherTable) ; select only those row corresponding to variable data, if there is anything else

  ;;; extract year-day of year pairs from the third and fourth columns
  set weatherInputData_YEARS map [row -> item yearColumn row ] weatherData

  ;;; NASA-POWER data uses year, month, day of month, instead of day of year,
  ;;; so we need to calculate day of year of each row ourselves
  set weatherInputData_DOY []
  set weatherInputData_yearLengthInDays []
  foreach (remove-duplicates weatherInputData_YEARS)
  [
    aYear ->
    let aDoy 1
    let lengthOfThisYear length (filter [i -> i = aYear] weatherInputData_YEARS)
    set weatherInputData_yearLengthInDays lput lengthOfThisYear weatherInputData_yearLengthInDays
    repeat lengthOfThisYear
    [
      set weatherInputData_DOY lput aDoy weatherInputData_DOY
      set aDoy aDoy + 1
    ]
  ]
  set weatherInputData_YEAR-DOY (map [[i j] -> (word i "-" j)] weatherInputData_YEARS weatherInputData_DOY)

  ;;; extract first and last year
  set weatherInputData_firstYear first weatherInputData_YEARS

  set weatherInputData_lastYear last weatherInputData_YEARS

  ;;; extract parameter values from the given column
  ;;; NOTE: read-from-string might be required if the original file is formated in a way that NetLogo interprets values as strings.

  set weatherInputData_solarRadiation map [row -> item solarRadiationColumn row ] weatherData

  set weatherInputData_precipitation map [row -> item precipitationColumn row ] weatherData

  set weatherInputData_temperature map [row -> item temperatureColumn row ] weatherData

  set weatherInputData_maxTemperature map [row -> item temperatureMaxColumn row ] weatherData

  set weatherInputData_minTemperature map [row -> item temperatureMinColumn row ] weatherData

end
There are other ways of doing this in NetLogo and many possible variations within this specific approach. The most important things here are to make sure that variable names are intelligible and all references to the internal structure of the CSV file are kept updated if any changes are made directly to the file. Abundant comments are also welcomed in this type of procedure.
26.4 Keeping tract of time in cycles
This module also introduces an aspect that may be relevant when inputting or generating time series: calendar time keeping. This may seem trivial, but it has often been a weak point in models relying on input data.
to advance-time

  set currentDayOfYear currentDayOfYear + 1

  if (currentDayOfYear > item (currentYear - weatherInputData_firstYear) weatherInputData_yearLengthInDays)
  [
    set currentYear currentYear + 1
    set currentDayOfYear 1
  ]

end
26.5 Setting daily weather values
The module than allows us to update the value of weather variables according to the synchronised calendar and simulation times, using year and dayOfYear as index:
to set-day-weather-from-input-data [ dayOfYear year ]

  ;;; find corresponding index to year-dayOfYear pair

  let yearAndDoyIndex position (word year "-" dayOfYear) weatherInputData_YEAR-DOY

  ;;; get values from weather input data

  set solarRadiation item yearAndDoyIndex weatherInputData_solarRadiation

  set T item yearAndDoyIndex weatherInputData_temperature

  set T_min item yearAndDoyIndex weatherInputData_minTemperature

  set T_max item yearAndDoyIndex weatherInputData_maxTemperature

  set RAIN item yearAndDoyIndex weatherInputData_precipitation

  if (dayOfYear = 1)
  [
    ;;; fill values of precipitation_yearSeries and precipitation_cumYearSeries, used here only for visualisation

    let yearLengthInDays item (currentYear - weatherInputData_firstYear) weatherInputData_yearLengthInDays
    let yearAndLastDoyIndex position (word year "-" yearLengthInDays) weatherInputData_YEAR-DOY

    set precipitation_yearSeries sublist weatherInputData_precipitation yearAndDoyIndex (yearAndLastDoyIndex + 1)

    let yearTotal sum precipitation_yearSeries
    set precipitation_cumYearSeries (list)
    let cumulativeSum 0
    foreach precipitation_yearSeries
    [
      i ->
      set cumulativeSum cumulativeSum + i
      set precipitation_cumYearSeries lput cumulativeSum precipitation_cumYearSeries
    ]
    set precipitation_cumYearSeries map [i -> i / yearTotal] precipitation_cumYearSeries
  ]

end
26.6 Wrapping everying together
Press “setup” and then “go” (continuous run). NetLogo will run until it reaches the last day of the last year included in the dataset. This is because we have added in go a stop condition.
to go

  advance-time

  ;;; values are taken from input data
  set-day-weather-from-input-data currentDayOfYear currentYear

  tick

  ; --- stop conditions -------------------------

  if (currentYear = weatherInputData_lastYear and currentDayOfYear = last weatherInputData_yearLengthInDays) [stop]

end
26.7 Checking the milestone File (module 3)
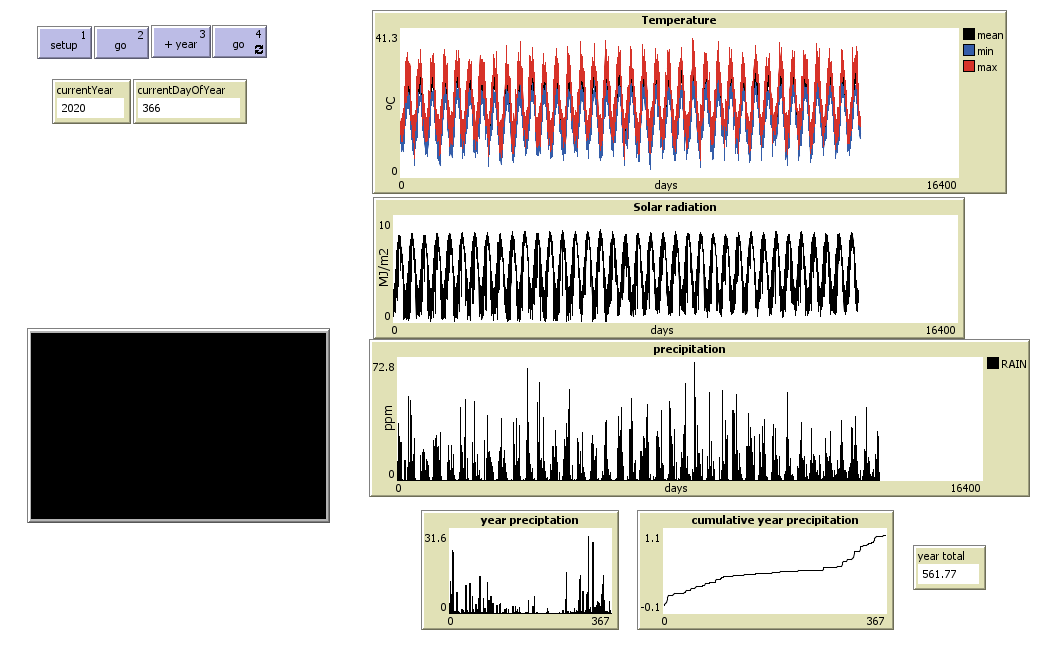
Screenshot of the ‘load-weather-data’ module
See the fully implemented version of this module: BlockC_module3_load-weather-data.nlogo. Check the widgets in the interface for how to reproduce the plots.