library(ggplot2)
library(readr)34 Loading and preparing simulation results
34.1 📊 Analysis Pipeline for Simulation Results
💾 Simulation outputs: BehaviorSpace CSV files
        ↓
📥 Import data: R, tidyverse
        ↓
🧹 Clean & prepare: Data wrangling, filtering, reshaping
        ↓
📈 Explore: Descriptive plots, distributions, correlations
        ↓
📊 Analyse: Statistical models, sensitivity analysis
        ↓
🖼️ Visualise: Publication-ready plots, dashboard
        ↓
🧩 Interpret: Compare with hypotheses, archaeological data
        ↓
📘 Report & share: RMarkdown, GitHub, Zenodo DOI
        ↺
🔁 Refine model or experiment design
34.2 Setting up our script environment
experiments_path <- "assets/netlogo/experiments/Artificial Anasazi_experiments "color_mapping <- c("historical households" = "blue",
"simulation households" = "darkred")34.3 Single run
expname <- "experiment single run"Read output:
results_single <- readr::read_csv(paste0(experiments_path, expname, "-table.csv"), skip = 6)Rows: 552 Columns: 11
── Column specification ────────────────────────────────────────────────────────
Delimiter: ","
chr (1): map-view
dbl (9): [run number], fertility, death-age, harvest-variance, fertility-end...
lgl (1): historic-view?
ℹ Use `spec()` to retrieve the full column specification for this data.
ℹ Specify the column types or set `show_col_types = FALSE` to quiet this message.Plot trajectories of metrics:
plot_name <- paste0(experiments_path, expname, "-trajectories.png")

png(plot_name, width = 840, height = 540)

ggplot(results_single) +
  geom_line(aes(x = `[step]`, y = `historical-total-households`, color = "historical data"),
            linewidth = 1.2) +
  geom_line(aes(x = `[step]`, y = `total-households`, color = "simulation households"),
            linewidth = 1.2) +
  labs(x = "steps", y = "households") +
  scale_color_manual(name = "", values = color_mapping) +
  theme(legend.position = "right")

dev.off()
svg
2 knitr::include_graphics(plot_name)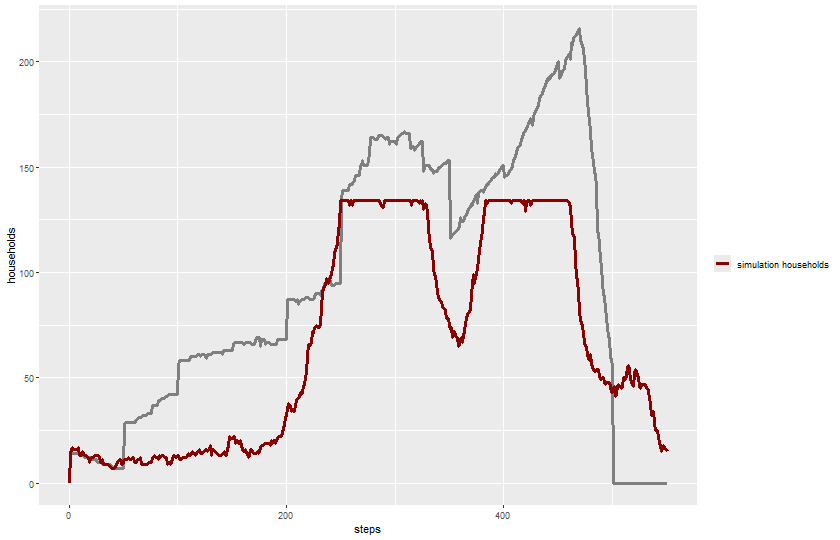
34.4 Multiple runs in single configuration
expname <- "experiment multiple runs"Read output:
results_single <- readr::read_csv(paste0(experiments_path, expname, "-table.csv"), skip = 6)Rows: 5520 Columns: 11
── Column specification ────────────────────────────────────────────────────────
Delimiter: ","
chr (1): map-view
dbl (9): [run number], fertility, death-age, harvest-variance, fertility-end...
lgl (1): historic-view?
ℹ Use `spec()` to retrieve the full column specification for this data.
ℹ Specify the column types or set `show_col_types = FALSE` to quiet this message.Plot trajectories of metrics:
plot_name <- paste0(experiments_path, expname, "-trajectories.png")

png(plot_name, width = 840, height = 540)

ggplot(results_single) +
  geom_line(aes(x = `[step]`, y = `total-households`, color = `[run number]`, group = `[run number]`),
            linewidth = 1.2) +
  geom_line(aes(x = `[step]`, y = `historical-total-households`),
            color = color_mapping["historical households"],
            linewidth = 1.2, linetype = 2) +
  labs(x = "steps", y = "households") +
  theme(legend.position = "right")

dev.off()
svg
2 knitr::include_graphics(plot_name)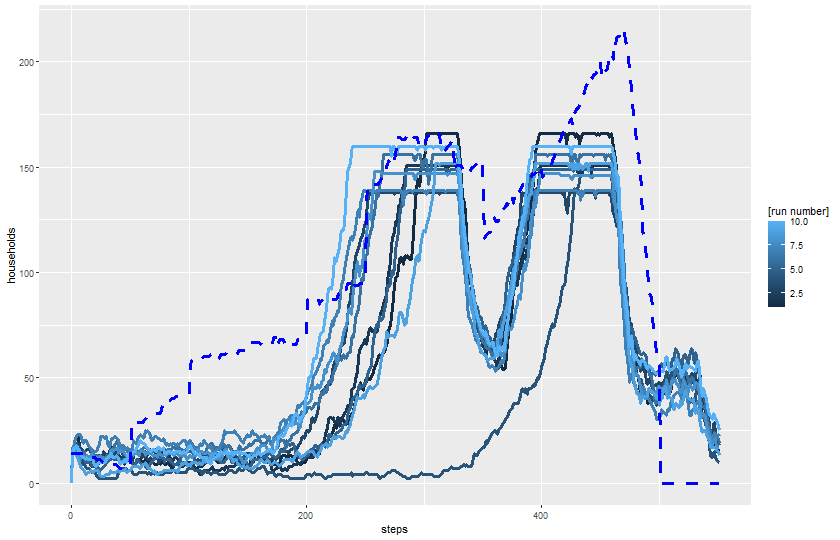
34.5 Parameter exploration - regular intervals
34.5.1 One parameter
expname <- "experiment harvest adjustment"Read output:
results_harvest_adj <- readr::read_csv(paste0(experiments_path, expname, "-table.csv"), skip = 6)Rows: 104880 Columns: 11
── Column specification ────────────────────────────────────────────────────────
Delimiter: ","
chr (1): map-view
dbl (9): [run number], fertility, death-age, harvest-variance, fertility-end...
lgl (1): historic-view?
ℹ Use `spec()` to retrieve the full column specification for this data.
ℹ Specify the column types or set `show_col_types = FALSE` to quiet this message.Plot trajectories of metrics:
plot_name <- paste0(experiments_path, expname, "-trajectories.png")

png(plot_name, width = 840, height = 540)

ggplot(results_harvest_adj) +
  geom_line(aes(x = `[step]`, y = `total-households`, color = `harvest-adjustment`, group = `[run number]`),
            linewidth = 1.2) +
  geom_line(aes(x = `[step]`, y = `historical-total-households`), color = "black",
            linewidth = 1.2, linetype = 2) +
  labs(x = "steps", y = "households") +
  theme(legend.position = "right")

dev.off()
svg
2 knitr::include_graphics(plot_name)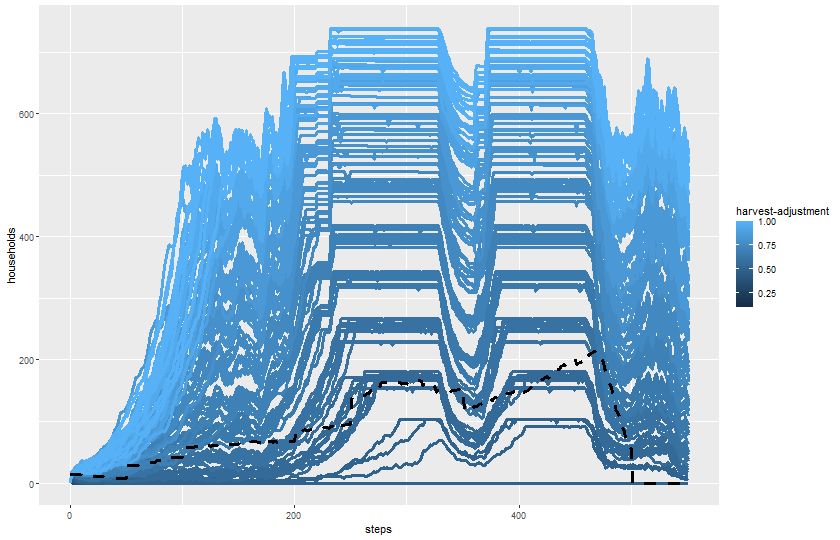
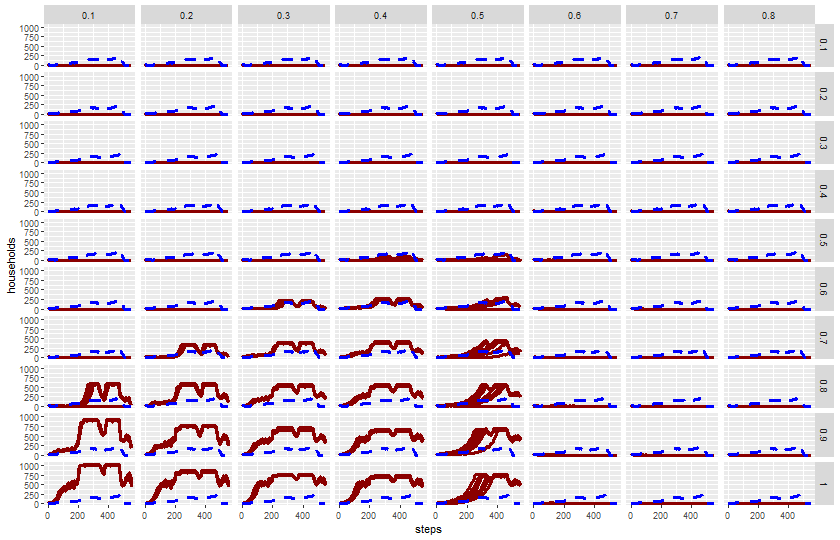
34.5.2 Two parameter
expname <- "experiment harvest adjustment variance"Read output:
results_harvest_adj <- readr::read_csv(paste0(experiments_path, expname, "-table.csv"), skip = 6)Rows: 441600 Columns: 11
── Column specification ────────────────────────────────────────────────────────
Delimiter: ","
chr (1): map-view
dbl (9): [run number], fertility, death-age, harvest-variance, fertility-end...
lgl (1): historic-view?
ℹ Use `spec()` to retrieve the full column specification for this data.
ℹ Specify the column types or set `show_col_types = FALSE` to quiet this message.Plot trajectories of metrics:
plot_name <- paste0(experiments_path, expname, "-trajectories.png")

png(plot_name, width = 840, height = 540)

ggplot(results_harvest_adj) +
  geom_line(aes(x = `[step]`, y = `total-households`, group = `[run number]`),
            color = color_mapping["simulation households"],
            linewidth = 1.2) +
  geom_line(aes(x = `[step]`, y = `historical-total-households`),
            color = color_mapping["historical households"],
            linewidth = 1.2, linetype = 2) +
  facet_grid(`harvest-adjustment` ~ `harvest-variance`) +
  labs(x = "steps", y = "households") +
  theme(legend.position = "right")

dev.off()
svg
2 knitr::include_graphics(plot_name)